What is the Commodity Channel Index (CCI)?
CCI (Commodity Channel Index) was developed by technical analyst Donald Lambert,He first started working in 1980"merchandise"magazine (current"futures" ) published this indicator on。Despite the name,CCI can be used in any market,not just goods。
CCI was originally developed to detect long-term trend changes,But after modification by traders,Available for all markets or time frames。Trading on multiple timeframes provides active traders with more buy or sell signals。Traders often use CCI on long-term charts to determine the dominant trend,Use CCI on short-term charts to isolate pullbacks and generate trading signals。
Strategies and indicators are not without flaws,Adjusting strategy criteria and indicator periods may provide better performance。Although all systems are prone to trading losses,But implementing a stop-loss strategy can help limit risk,And testing the profitability of the CCI strategy within your market and timeframe is a worthwhile first step before starting trading。1
Main points
- CCI is a market indicator,Used to track market movements that may indicate buying or selling。
- CCI compares the current price to the average price over a specific time period。
- Different strategies can use CCI in different ways,Including using it on multiple time frames to establish dominant trends、Pullback or trend entry and exit。
- when things get unstable,Some CCI based trading strategies may produce multiple false signals or losing trades。2
How CCI foreshadows new trends
Due to the versatility of CCI oscillators,It is often used to identify market reversals and divergences。
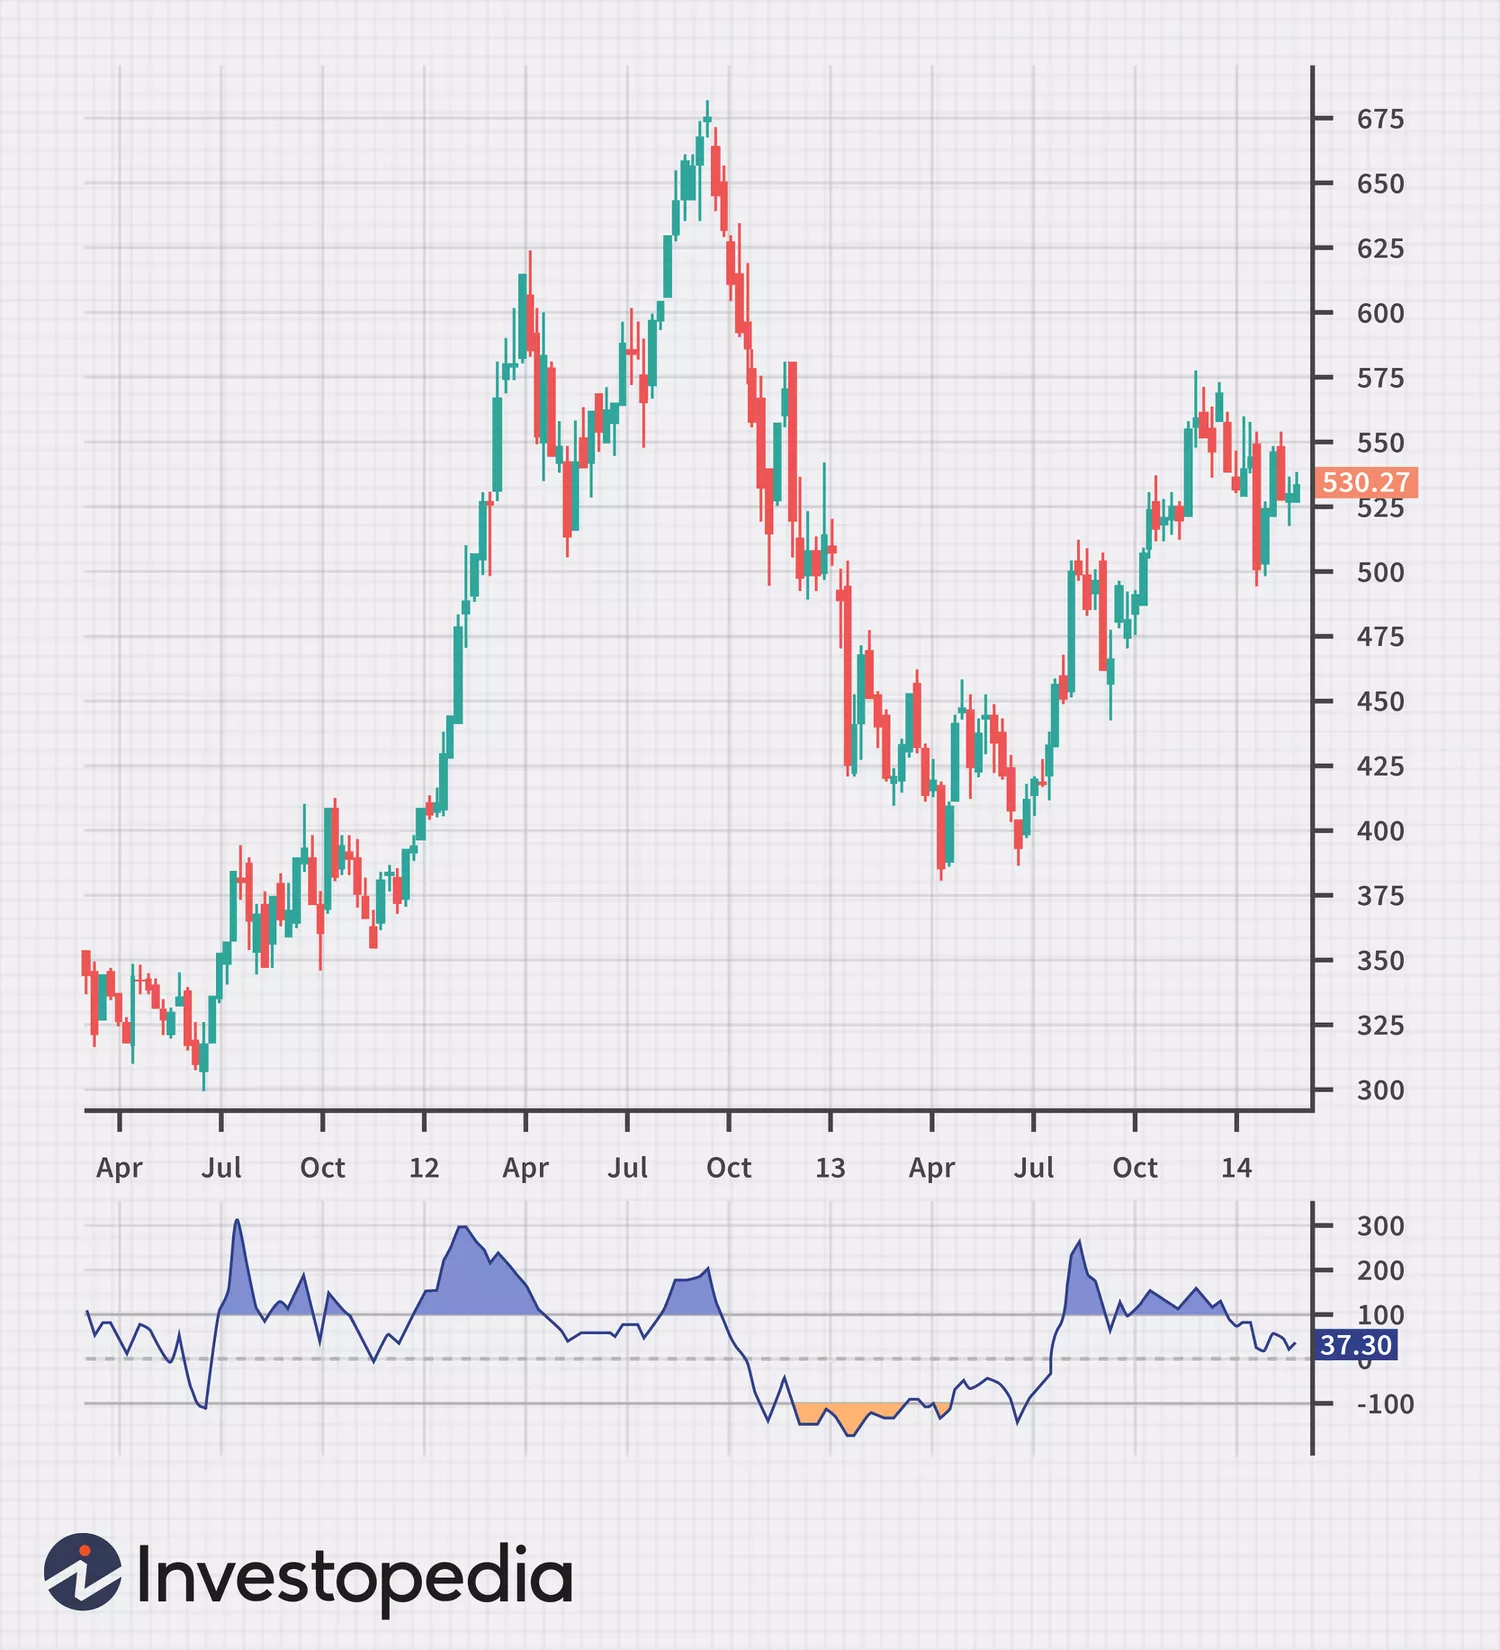
CCI is usually +100 and -100 oscillation between。higher than +100 The value of indicates an overbought condition,Indicates a potential downside reversal。相反,lower than -100 A value of indicates an oversold condition,Indicates a potential upward reversal。3
Zero line crossovers can also be used to identify emerging trends。When CCI crosses above the zero line,Often viewed as a bullish signal,And when CCI crosses below the zero line,is considered a bearish signal。3
Another determinant of new trends in CCI is the divergence。If asset prices hit new highs,But CCI failed to break above previous highs,indicates a bearish divergence。same,If prices hit new lows,But CCI fails to hit new lows,then indicates a bullish divergence。3
in some cases,Traders draw trend lines on CCI charts。on price chart,A trendline breakout usually precedes a trendline breakout,Provides early signals of trend changes。
also,Using CCI on multiple timeframes provides a more robust signal。For example,A bullish signal on the daily chart supplemented by a bullish signal on the weekly chart can provide greater confidence in trading。
also,Combining CCI signals with price action patterns such as candlestick patterns can provide more reliable entry and exit signals。
Use CCI to spot overbought or oversold conditions
CCI can be used to identify overbought or oversold conditions in trading instruments。
Identify overbought conditions
There are several ways to identify overbought conditions。They are as follows:3
- +100阈值:When CCI is above +100,The asset is generally considered to be overbought。This suggests that prices may be too high relative to the average,A pullback or reversal may occur。
- extreme level:Some traders believe even higher levels,Such as +200 or +300,All are extremely overbought,Indicates that prices are more likely to fall。
- departure:If asset prices hit new highs,But CCI fails to hit new highs,This bearish divergence could signal an imminent price reversal。
Identify oversold conditions
There are several ways to identify oversold conditions。They are as follows:3
- -100阈值:When CCI is below -100,The asset is generally considered oversold。This suggests that prices may be too low relative to the average,A rebound or reversal may occur。
- extreme level:Some traders believe even lower levels,Such as -200 or -300,All are extremely oversold,Indicates that prices are more likely to rise。
- departure:If asset prices hit new lows,But CCI fails to hit new lows,This bullish divergence could signal an imminent price reversal。
Other considerations
Some additional considerations when spotting overbought or oversold conditions include duration、Confirmation and Market Background。The length of time the CCI (duration) remains in overbought or oversold territory can also provide clues。A quick in and out may not be as important as a persistent situation。
Another consideration is to confirm。Before making a trading decision based solely on CCI,It is often wise to seek confirmation from other indicators or chart patterns。
at last,CCI effectiveness may vary depending on market conditions。It tends to be more effective in trending markets than sideways or range markets。
Find bullish and bearish divergences using CCI
CCI can be used to spot bullish and bearish divergences。As it relates to bullish divergence,Traders first look to see when an asset price makes lower lows。at the same time,CCI should make higher lows。When CCI moves upward and crosses the zero line or above a certain threshold (usually -100),Bullish divergence will be confirmed。3
Since bearish divergence is involved,Traders first look for instances where the asset price made higher highs。at the same time,CCI highs should be lower。When CCI moves downward and crosses the zero line or below a certain threshold (usually +100),Confirmation of bearish divergence。3
if used properly,Divergence can be a powerful signal,but should not be used alone。Traders should consider the broader market context,and seek confirmation from other indicators or methods to validate the signal。3
Advantages of Using CCI to Help Make Trading Decisions
Some advantages of using CCI to help make trading decisions include:4
- Overbought and oversold level identification:CCI measures the current price level relative to the average price level over a given period。Reading is higher than +100 表示超买状况,while readings below -100 Indicates oversold condition。
- Trend identification:CCI can be used in a variety of financial instruments to identify trends。It oscillates around the zero line,Crossing this line can serve as confirmation to buy or sell the instrument in question。
- Deviation detection:CCI can be used to spot divergences between indicators and price action,This can signal a potential trend reversal。
- Versatility:CCI can adapt to various time frames。For day trading,20 Cycles of CCI are quite common,And for longer time frames,Commonly used 50 or 100 cycles。
- Various trading strategies:CCI is often used in conjunction with other indicators and price action,for a more robust trading strategy。
- Based on formula:CCI calculation is easily implemented in automated trading systems。
Disadvantages of Using CCI to Help Make Trading Decisions
There are several disadvantages to using CCI to help make trading decisions。These include:5
- false signal:CCI often generates false signals。Traders may interpret sideways or range-bound moves as buy or sell signals,Which leads to wrong trading decisions。
- lagging indicator:CCI is a lagging indicator,This means it tends to confirm price movements after the fact。This may cause delays at entry or exit points,thereby potentially reducing profitability。
- complexity of interpretation:The CCI formula involves multiple variables,Includes the highest price during a specific period、Lowest price and closing price。This complexity can make it difficult for novice traders to accurately interpret signals。
- Sensitivity to market instruments:CCI is sensitive to short-term fluctuations (often called market noise)。This may cause the CCI value to change frequently,making it difficult to identify obvious trends。
- Limited information:While CCI can indicate overbought or oversold conditions,But it does not directly provide information about the duration of the trend or potential reversal points。
Calculate CCI
CCI is calculated using the following formula:4
��i = (time phosphorus - �M� (time phosphorus,Nitrogen)/(0。015*�)C C I=(TP _-SMA ( TP , _ _ _N ) / ( 0 . 0 1 5*D )
Where
- TP = typical price,Calculated as the highest price、The average of the lowest and closing prices。
- SMA(TP,N) = Simple moving average of typical prices over N periods。
- D = mean deviation,Calculated as the SMA for each typical price over N periods(TP,N) the mean of the absolute differences between。
The numerator of the CCI formula is the difference between a typical price and its simple moving average over N periods。The denominator is the average deviation times 1.5%,for scaling CCI。
CCI measures the deviation of typical prices from their average value over a specific period。1.5% The scaling factor ensures that approximately 70% arrive 80% The CCI value falls within -100 arrive +100 between,Makes it easier for traders to identify overbought and oversold conditions。
Learn about CCI
The CCI technical analysis indicator helps traders identify overbought or oversold conditions,and the strength and direction of the trend.。It measures the deviation of an asset's price from its statistical mean,Commonly used 20 input cycles。4
CCI oscillates around zero line,Its value is usually between -100 arrive +100 between,But it may also exceed these ranges。4
General example of using CCI
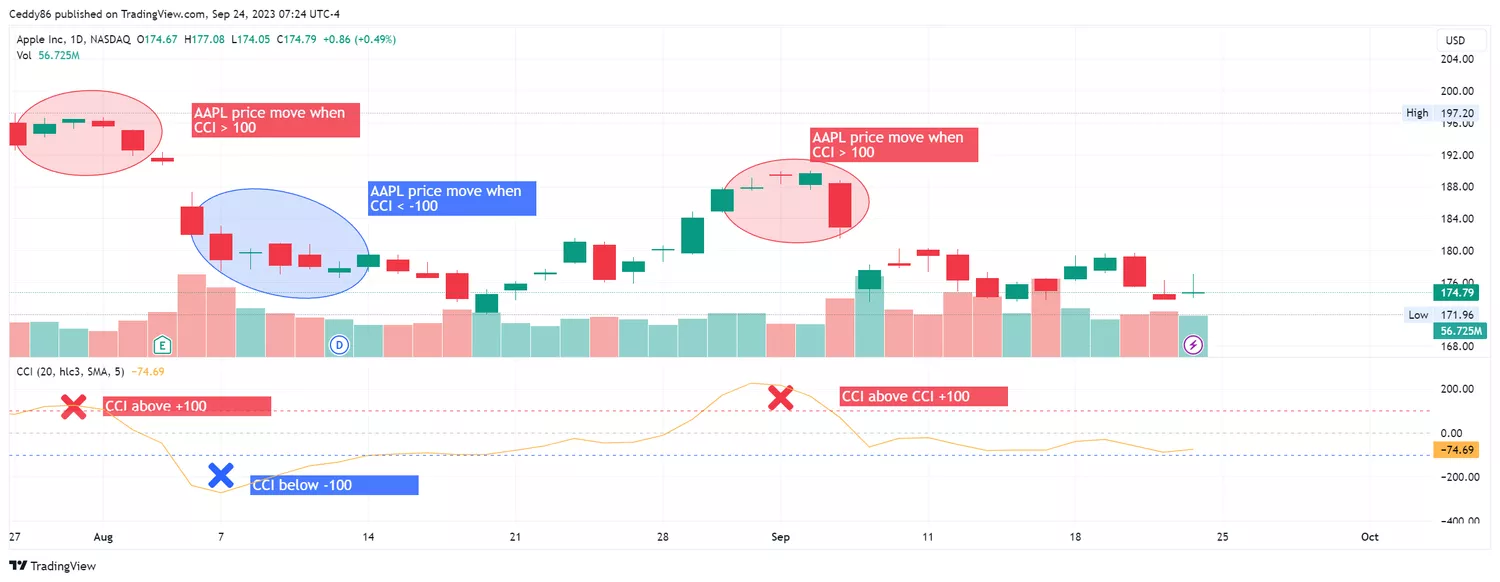
In this example,CCI acts as a useful oscillator,Through its work at Apple Inc. ( AAPL ) The application is demonstrated on the daily chart。2023 Year 7 moon 28 day,AAPL’s CCI Breakout +100 门槛,表明超买状况。The indicator has remained above this level for several trading days,Then at 2023 Year 8 moon 2 day falls to +100 below。The reversal comes as AAPL shares fall 5.33% harbinger of。
CCI then fell below the -100 mark,Indicates an oversold condition。It hovered in this area for about six trading days,Until it rebounds above the -100 level on August 15, 2023。CCI's upward move coincides with AAPL stock price rise over the same period 5.76% consistent。This simple example illustrates the efficacy of CCI in identifying potential reversals in market conditions,Thus becoming a valuable tool for traders to gauge entry and exit points。
 AAPL and CCI daily chart。
tradingview.com

CCI as a fundamental momentum strategy
The Commodity Channel Index (CCI) can be used as a momentum-based trading strategy。In simple many/null method,Traders can enter long positions when CCI crosses above the zero line,and switch to a short position when CCI crosses below the zero line。
Use CCI on multiple timeframes
Leveraging CCCI across multiple timeframes can give traders a more granular understanding of market conditions。Some advantages include higher trading probability。When traders align their trades with broader market trends,The likelihood of success will increase。4
also,Using two timeframes or multiple timeframes can help filter out false signals,thereby reducing the risk of entering into unprofitable trades。also,There is also a certain degree of flexibility。Multi-timeframe strategies can be adapted to a variety of asset classes,Can also be used in conjunction with other technical or fundamental indicators,for more robust trading signals。4
Are there any other technical analysis indicators similar to CCI?
Several technical analysis indicators similar to CCI include Stochastic CCI、relative strength index (RSI)、moving average convergence divergence (MACD)、rate of change (ROC)、Momentum Oscillator and Williams Percent R。
What is the best time frame to use CCI?
CCI is a multifunctional technical indicator,Can be applied to various time frames。The choice of time frame largely depends on the trader’s strategy and goals。Traders must properly backtest their strategies on different time frames,to find the strategy that best meets their trading goals。
What are the best assets to trade with CCI?。
最初,CCI is designed for commodity markets,But now widely used across various asset classes,Includes stocks、ETF、Futures and Forex。
What fundamentals can be combined with CCI to make it more effective?
By combining economic indicators、Essential tools like earnings reports and market news are combined with technical analysis signals provided by CCI and other technical indicators,Traders can make more informed decisions。
How can the use of CCI be made more reliable?
Traders can combine this with the volume indicator to confirm the strength of the trend indicated by the CCI。also,Before applying CCI in live trading,Strategies should be backtested on historical data,to analyze past performance。
Summarize
CCI is a multifaceted technical indicator,Can help traders with all aspects of stock trading,From identifying emerging trends to spotting overbought or oversold conditions。It is particularly useful for detecting bullish and bearish divergences,This can indicate a potential price reversal。CCI’s versatility allows it to be applied to different time frames and asset classes,Making it a flexible tool for traders。However,it is not without disadvantages,For example, the risk of generating false signals。
To alleviate these limitations and improve its reliability,Traders often use CCI in conjunction with other technical indicators。Incorporating fundamental analysis and employing risk management techniques such as setting stop-loss and take-profit levels can also add robustness to CCI-based trading strategies。overall,If used wisely and in conjunction with other analytical tools,CCI can be a powerful tool for making informed and potentially profitable trading decisions。
sponsor

